

Special Articles on 5G Evolution & 6G—Research of Radio Access Technologies Above 100 GHz toward 6G—
Enhancement of 6G System-level Simulators
6G Sub-terahertz Band System-level Simulator
Kiichi Tateishi, Koshiro Kitao and Satoshi Suyama
6G Network Innovation Department
Takayuki Yamada
NTT Corporation
Abstract
In 6G, the goal is to provide extremely high-data-rate communications exceeding 100 Gbps, and to this end, the use of the sub-terahertz band from 100 to 300 GHz is being studied. NTT DOCOMO has been developing a 6G system-level simulator to evaluate 6G system performance when using the sub-terahertz band. This article describes two types of 6G simulators developed with the aim of enhancing our original simulator: a simulator that introduces distributed MIMO technology in an outdoor urban environment (added scenario) and a simulator that uses point cloud data to model a real indoor environment with high accuracy.
01. Introduction
-
In the 6th Generation mobile communications system (6G), ...
Open

In the 6th Generation mobile communications system (6G), we can expect new combinations of requirements that go beyond the requirements of the 5th Generation mobile communications system (5G) consisting of high-data-rate, high-capacity, ultra-reliable and low-latency communications, and massive connectivity. We can also expect new use cases that will require extremely high performance that is difficult for even 5G to achieve [1][2]. Specifically, extremely high data rates and capacities exceeding 100 Gbps as the peak data rate of 6G should achieve services that can deliver new user experiences to provide a quality of experience equal to or exceeding that of the five human senses.
In addition, we can expect the 6G era to achieve an advanced Cyber-Physical System (CPS)*1 that reproduces the real world in cyber space with the aim of making predictions about the future and obtaining new knowledge by combining 6G and Artificial Intelligence (AI) technology. Such a CPS should lead to the creation of novel services and solutions in a wide variety of industrial fields. It is therefore extremely important to achieve high-data-rate and high-capacity communications in the UpLink (UL) too toward an advanced CPS in 6G.
To achieve extremely high-data-rate communications exceeding 100 Gbps in 6G, studies are examining the use of the so-called sub-terahertz band from 100 to 300 GHz that can provide dramatically wider signal bandwidths compared with 5G. The sub-terahertz band, however, suffers from rectilinearity higher than that of the millimeter-wave*2 band used in 5G and larger path loss*3. At NTT DOCOMO, we have been working to resolve these issues by devising technical solutions and testing their effectiveness [3]–[6].
On the other hand, when setting out to use high-frequency bands such as the sub-terahertz band in a system, it is necessary to not only test individual technologies but to also evaluate system performance early on when arranging multiple Base Stations (BSs) and Mobile Stations (MSs) and to clarify any performance-improvement effects on a system level. It is also necessary to identify any issues at this time. However, since an appropriate amount of time and expenses are generally required to develop equipment, and since it is necessary to ensure a degree of freedom in changing system configuration, parameters, etc., we developed a 6G system-level simulator (hereinafter referred to as “6G simulator”) at NTT DOCOMO to assess the feasibility of achieving extremely high-data-rate communications as a system when using the sub-terahertz band and tested its performance [7]. This 6G simulator had a function for evaluating throughput when using the 100 GHz band in two types of indoor scenarios simulating a shopping mall and factory, and with this function, we confirmed that a throughput exceeding 100 Gbps could be achieved in both scenarios. However, this 6G simulator did not support performance evaluation in outdoor environments for which a relatively wide area is targeted or performance evaluation when deploying 6G in environments that model arbitrary real environments.
In response to this situation, and with the aim of developing enhanced 6G simulators, we have developed a simulator that introduces distributed Multiple Input Multiple Output (MIMO)*4 technology in an outdoor urban environment as an added scenario and a simulator that uses point cloud data to model a real indoor environment with high accuracy. In this article, we present a functional overview of these two types of 6G simulators (hereinafter referred to as “enhanced simulators”) and describe examples of evaluating their performance.
- CPS: Services and systems for achieving a more advanced society by collecting information in real (physical) space by various types of sensors and connecting that information to virtual (cyber) space.
- Millimeter wave: A division of the frequency band. Radio signals in the frequency band from 30 GHz to 300 GHz.
- Path loss: The amount of attenuation in the power of the signal emitted from the transmitting station till it arrives at the reception point.
- Distributed MIMO: A MIMO transmission technology that transmits different MIMO streams from multiple base stations to a single mobile station.
-
1) Application of the Sub-terahertz Band
Open
Our original 6G simulator was developed to quantitatively test the 6G requirements and technical concepts described in NTT DOCOMO’s 6G white paper [1] and to test the possibility of applying the sub-terahertz band from a system perspective [7]. For our enhanced simulators as well, we envision the application of the sub-terahertz band to the system to achieve extremely high-data-rate communications exceeding 100 Gbps in a more stable manner under the constraints of using the same BS antenna size as that of the sub-6 GHz (Sub6)*5 band and millimeter-wave band and the same transmission power as 5G. When using the sub-terahertz band, the number of antenna elements in a massive MIMO*6 antenna can be greatly increased thereby enabling high BeamForming (BF)*7 gain to be obtained. As a result, the large path loss associated with the sub-terahertz band can be compensated for.
2) Adoption of RIS and Moving BSs
In 6G, one way of securing coverage*8 in high-frequency bands, improving connectivity, and reducing power consumption is to establish communications over short distances or in a Line-Of-Sight (LOS) environment as much as possible and to prepare as many redundant communication paths as possible so that the most appropriate one can be selected. In other words, New Radio Network Topology (NRNT) for constructing distributed radio network topology*9 in the space domain is becoming an important technical area [1][2]. In NRNT, a variety of technologies are being studied including the use of existing objects such as streetlamps and lighting fixtures for mounting antennas, development of advanced repeater technology, use of Reconfigurable Intelligent Surface (RIS)*10 reflectors that can dynamically control reflection intensity and direction, the use of moving BSs, and MS-to-MS linking, all of which refer to nodes*11 configuring a network topology and the technologies adopted for them [1]. For our enhanced simulators we have adopted RIS and mobile BSs as NRNT technology to improve the received power of the sub-terahertz band and to secure coverage even in Non-Line-Of-Sight (NLOS)*12 areas and have enabled the evaluation of system performance in an outdoor urban environment.
3) Simulator Using a Model of an Outdoor Urban Environment (Added Scenario)
Our original 6G simulator supported only two types of indoor scenarios simulating a shopping mall and factory. However, it is also important to expand the service area using the sub-terahertz band outdoors and to evaluate system performance when expanding an area by combining the sub-terahertz band with the Sub6 or millimeter-wave band and using moving MSs. With this in mind, and with the aim of creating an enhanced version of our original simulator, we have developed a simulator with the added scenario of using the three frequency bands of Sub6, millimeter wave, and sub-terahertz in an outdoor urban environment. In this case, it must be considered that reflected waves off of wall surfaces in an outdoor environment decrease compared with that in an indoor environment and that the propagation distance of radio waves is relatively long, all of which makes it difficult to achieve high throughput. In this simulator, we have improved throughput by combining NRNT with distributed MIMO—a form of massive MIMO using a distributed type of antenna deployment—as a countermeasure technology for this problem.
4) Simulator Using a Model of a Real Environment Based on Point Cloud Data
When studying the deployment of a 5G or 6G system in a specific environment such as an indoor environment or factory, it is important to evaluate system performance beforehand such as throughput in the target environment. In addition, the ability to visualize system performance can provide very useful information in deciding on a method for deploying the communications system. Our original simulator, however, was only able to evaluate throughput for scenarios/environments prepared beforehand, namely, a shopping mall and factory.
Estimating throughput with high accuracy requires accurate estimation of the radio propagation characteristics in the environment where the communications system is to be deployed. A technique for estimating propagation characteristics with high accuracy that has been attracting attention in recent years is to use point cloud*13 data obtained from the evaluation environment to create a polygon model of structures and to use that model for ray tracing*14 calculations [8]–[11]. With the aim of evaluating system performance in real environments, we have developed an enhanced simulator that can evaluate and visualize 5G and 6G throughput based on propagation characteristics obtained by ray tracing calculations that employ a real-environment model based on point cloud data.
The following describes in more detail the enhanced simulator with an added scenario in 3) and the enhanced simulator in 4) above.
- Sub6: A division of the frequency band. A radio signal with a frequency between 3.6 GHz and 6 GHz.
- Massive MIMO: MIMO transmission formats use multi-element antennas at both transmitter and receiver to spatially multiplex the radio signal. Massive MIMO is a technique that is able to realize narrow radio wave beam forming, to compensate for path loss when using high frequency bands or to transmit more streams at the same time, by utilizing largescale antennas with even more elements. This can achieve high speed data communications while securing the desired service area.
- BF: A technique for increasing or decreasing the gain of antennas in a specific direction by controlling the amplitude and phase of multiple antennas to form a directional pattern of the antennas.
- Coverage: The area (cell radius) over which a single base station can communicate with MSs. The number of base stations that need to be installed decreases as coverage increases in size.
- Topology: Positional relationship of devices, network configuration, etc.
- RIS: A reflector that can be used to arbitrarily design the direction of reflected waves and beam shape by arranging microstructures each smaller than the wavelength called metamaterials on a plane.
- Node: A network point that propagates a value received from input.
- NLOS: Describes an environment where there are obstacles between the transmitter and receiver. In this case, communication can only take place over waves that have been reflected, refracted, etc.
- Point cloud: Data that groups the coordinates of an object’s shape obtained by irradiating an object such as a building with a laser and measuring the arrival direction and propagation time of scattered laser light.
- Ray tracing: A method of simulating propagation characteristics by treating radio waves like light and tracing their paths.
-
3.1 Simulator Functions
Open
This simulator with an added scenario introduces distributed MIMO at the BS for both the DownLink (DL) and UL. In distributed MIMO, a BS consists of multiple Transmission and Reception Points (TRPs)*15 corresponding to BS antennas and a central station that consolidates those TRPs. Here, throughput can be improved through cooperative transmission/reception at multiple TRPs (transmission/reception of the same or different MIMO streams*16 with the same MS). In the conventional system that does not apply distributed MIMO, there is no cooperative transmission/reception by different TRPs, which means that an MS performs transmission/reception with only one TRP. This enhanced simulator installs multiple TRPs fixed to positions established beforehand and evaluates DL and UL throughput characteristics of each MS during (cooperative) transmission/reception between those TRPs and the MS. In addition, this simulator provides services while a drone TRP moves along a specific path to reduce path loss due to blocking. Robots and self-driving vehicles are also arranged as MSs in addition to devices possessed by people.
The effects of path loss and blocking loss in the sub-terahertz band are much greater compared with the millimeter wave band. To compensate for this increase in path loss, this simulator introduces a massive MIMO antenna consisting of multiple sub-arrays*17 at each TRP. Moreover, in accordance with the positional relationship between a sub-terahertz-band TRP and MS and whether any obstacles exist between the TRP and MS, the simulator determines the received power at each MS after calculating path loss and blocking loss and uses that received power to determine the appropriate combination of TRPs (fixed, drone) and RIS reflectors with each MS. Moreover, when using RIS reflectors, the simulator calculates path loss using the path lengths from TRP to RIS and RIS to MS. To simplify the evaluation, it is assumed that the reflection direction by an RIS reflector can be ideally controlled and that an RIS reflector can be virtually treated as a fixed TRP performing BF. In short, the simulator uses the received power calculated in the above way to ideally switch to the TRP that can communicate with the MS without delay.
To provide communications for multiple MSs, a BS (1) performs scheduling to allocate radio resources*18, (2) performs transmit precoding*19, (3) determines the modulation level*20, and (4) performs rank adaptation*21.
- The scheduling process allocates resources in the time domain*22 in units of slots*23 and in the frequency domain*24 based on a Round Robin (RR) algorithm*25 across all bands. Resource allocation is performed for each TRP sub-array. The maximum number of sub-arrays that can be allocated to a single MS is the same as the number of sub-arrays maintained by the MS. In addition, MS selection and scheduling are repeated until scheduling for all TRPs has been completed or until there are no more MSs targeted for scheduling.
- When applying distributed MIMO, transmit precoding will be executed for the sub-arrays of all TRPs under the central station, but when not applying distributed MIMO, transmit precoding will be executed only among the sub-arrays within a TRP.
This simulator uses a Maximum Ratio Combining (MRC)*26 precoder and a Singular Value Decomposition (SVD)*27 precoder for transmit precoding. The MRC precoder begins by subjecting the channel matrix*28 of the propagation channel to a Hermitian transpose*29 and extracting the elements in the column direction only for a number of rows corresponding to the number of MIMO layers*30 for each MS being allocated resources. It then calculates a precoding matrix*31 by taking the arithmetic mean using the elements of all reception sub-arrays as seen from each transmit sub-array. The SVD precoder performs an eigenvalue decomposition on the covariance matrix*32 of the channel matrix and extracts eigenvalues from that matrix in descending order only for a number of rows corresponding to the number of MIMO layers of all MSs being allocated resources. Since eigenvalue decomposition is necessary here, computational complexity is greater for the SVD precoder than for the MRC precoder, the effect of which can be significant if the number of TRPs to be controlled increases. On the other hand, the SVD precoder can achieve superior transmission characteristics compared with the MRC precoder in the case of MIMO spatial multiplexing. - After transmit precoding, the BS determines the modulation level according to the average Signal to Interference plus Noise power Ratio (SINR)*33 estimated using the channel matrix and precoding matrix.
- Rank adaptation, which is performed simultaneously with modulation-level determination, adaptively controls the number of layers based on the number of layers in MIMO spatial multiplexing that can be transmitted as calculated for each MS.
Reception processing at each TRP and MS performs signal detection by a receiver in which the Minimum Mean-Squared Error (MMSE)*34 norm using the channel matrix is used as a basis for Interference Rejection Combining (IRC)*35 (MMSE-IRC receiver). This simulator computes the block error rate from the received SINR of the detected signal and calculates throughput on the DL and UL.
3.2 Evaluation Scenario and Simulation Results
1) Overview
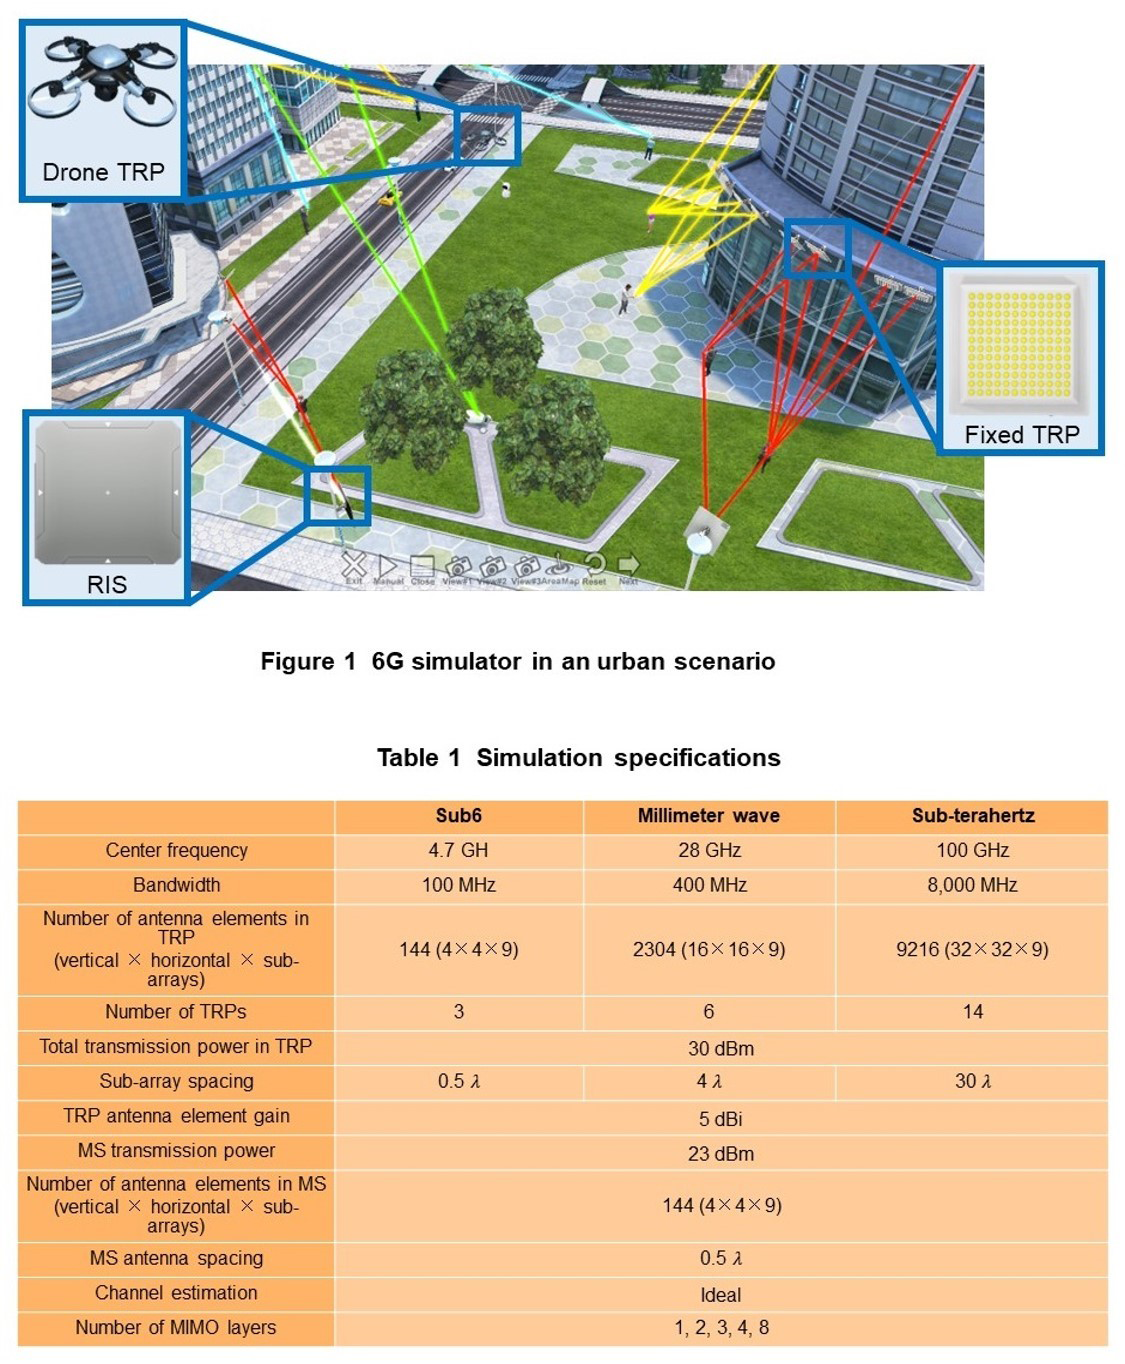
This simulator simulates an outdoor urban environment. It can execute a simulation-based evaluation at the system level in a scenario that deploys 5G and 6G in such an environment. The urban scenario achieved by this simulator is shown in Figure 1. This environment includes an open public square surrounded by high-rise buildings. The square includes no reflecting objects but is lined with trees. People, robots, and self-driving vehicles are either stationary or moving. Fixed TRPs and RISs are installed on the walls of buildings or on streetlamps and a drone TRP makes a round trip in the air along a roadside to provide services to MSs situated away from buildings in the square. The backhaul*36 for the drone TRP is assumed to be ideally constructed.
Simulation specifications are listed in Table 1.The center frequency*37 of each of the Sub6, millimeter-wave, and sub-terahertz bands is 4.7 GHz, 28 GHz, and 100 GHz, respectively, and the bandwidth of each is 100 MHz, 400 MHz, and 8,000 MHz, respectively. The massive MIMO antenna of a TRP uses a planar array*38 and consists of nine sub-arrays, each of which performs analog BF of a single beam by an analog circuit. The total transmission power of a fixed TRP and drone TRP is set to 30 dBm regardless of the number of sub-array elements. The duplex mode*39 used here is Time Division Duplex (TDD)*40 with a DL/UL time ratio of 7:3 across all slots. This evaluation environment consists of an arrangement of 22 MSs with 18 persons possessing an MS and the remaining four MSs mounted on two robots and two self-driving vehicles. People and robots are moving at 3 km/h while self-driving vehicles are moving at 60 km/h, both without stopping. The maximum number of MIMO layers per MS that can be transmitted according to the propagation environment is selected as described above from candidates 1, 2, 3, 4, or 8. In the sub-terahertz band, it is assumed here that a throughput generally greater than 100 Gbps can be achieved with 4 or more layers. The propagation environment is a multipath Rayleigh fading*41 channel model*42 in which spatial correlation*43 among antenna elements is given according to TRP and MS positions and the antenna configuration. The following presents simulation results only for the case of using SVD as transmit precoding.
2) Simulation Results
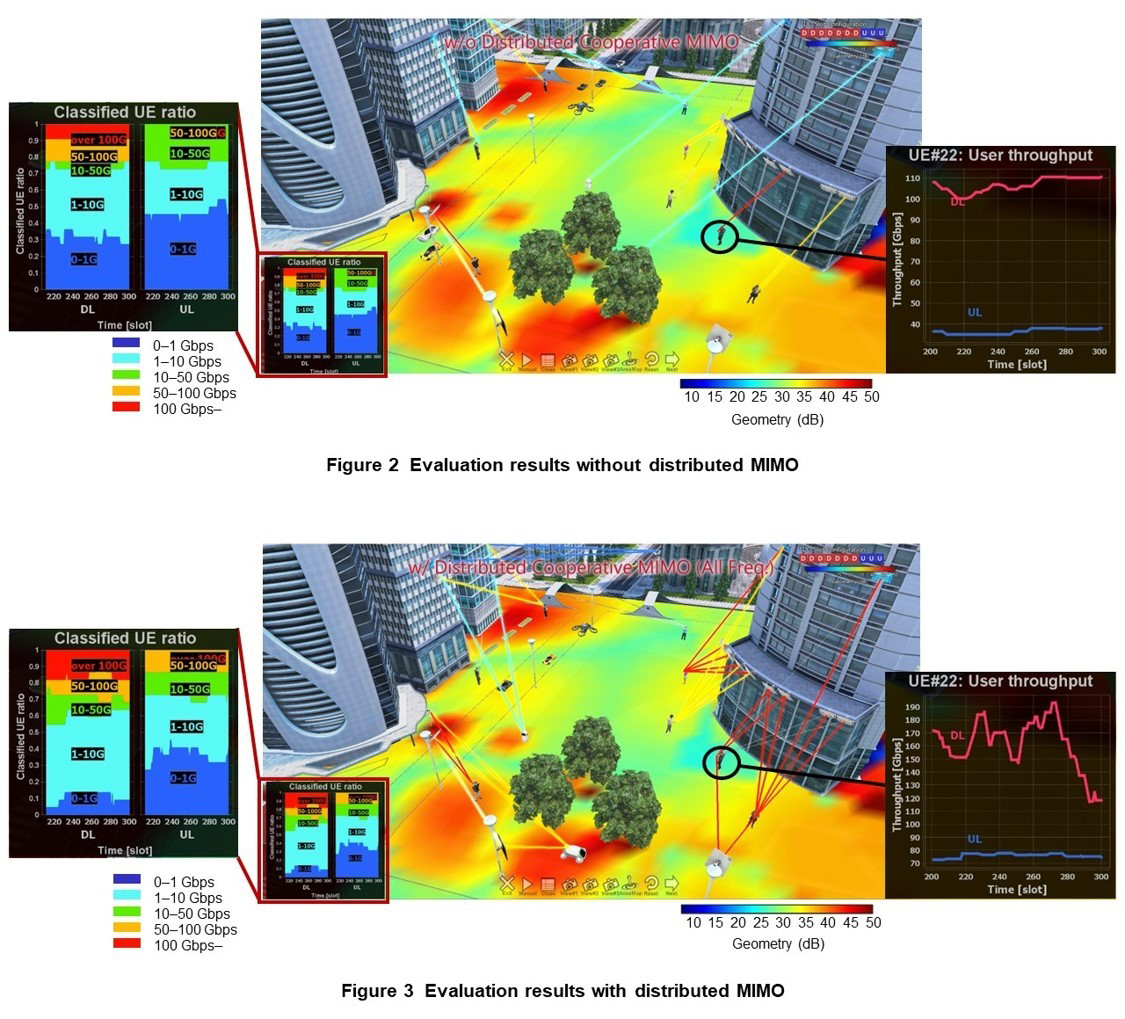
The results of calculating geometry*44 and the MS throughput ratio when not applying distributed MIMO are shown in Figure 2. Geometry is expressed in terms of colors on the screen in the range of 10–50 dB. In addition, the graphs at the left of the figure show throughput ratios for the DL and UL. Here, the throughputs of 0–1 Gbps, 1–10 Gbps, 10–50 Gbps, 50–100 Gbps, and 100 Gbps or greater are expressed as five different colors with the horizontal axis and vertical axis representing time (slot number) and throughput ratio, respectively. The colors of the straight lines connecting a TRP and MS in the figure correspond to these throughput colors. The graph at the right of the figure shows the throughput for User Equipment (UE) #22 positioned in front of a high-rise building and circled in black with the horizontal axis and vertical axis representing time (slot number) and throughput, respectively.
From Fig. 2, it can be seen that geometry decreased in the square due to greater path loss at points further away from a building but that it also improved due to the use of RISs and a drone TRP. In addition, the drop in geometry near UE #22 can be attributed to the many TRPs installed on the periphery of the nearest building resulting in the arrival of many interfering signals. The graphs at the left of the figure show that about 70% of the MSs could achieve a throughput over 1 Gbps in the DL while about 9% could achieve a throughput over 100 Gbps. The graph at the right of the figure shows that UE #22 could stably obtain a throughput over 100 Gbps in the DL and around 40 Gbps in the UL. Users in good environments could enjoy throughputs exceeding 100 Gbps thanks to the effects of greater bandwidths in the sub-terahertz band.
Next, Figure 3 shows evaluation results when applying distributed MIMO for the same installation positions of fixed TRPs as those in Fig. 2. The graphs at the left of the figure show that about 90% of the MSs could achieve a throughput over 1 Gbps in the DL while about 18% could achieve a throughput over 100 Gbps. Furthermore, in the UL, more than 10% of the MSs could obtain a throughput of 50–100 Gbps demonstrating the effect of applying distributed MIMO. The graph at the right of the figure shows that the throughput of UE #22 was greater than 100 Gbps in the DL increasing to 190 Gbps at peak time and reaching nearly 80 Gbps in the UL. These results demonstrate that significantly higher throughput could be achieved compared with the case of not applying distributed MIMO (Fig. 2).
The above simulation results clarify that throughput can be greatly improved in both the UL and DL by applying distributed MIMO even in an environment in which a spatial multiplexing effect by MIMO cannot be expected due to a relatively small number of reflected waves and many LOS environments as in an urban scenario.
- TRP: The point of transmission and reception of radio signals at a base station.
- MIMO stream: A data sequence that is spatially multiplexed when using multiple transceiver antennas with MIMO technology.
- Sub-arrays: When generating L beams in massive MIMO having N antenna elements, a sub-array configuration enables a single beam to be generated using only N/L elements thereby reducing the scale of circuitry.
- Radio resources: General term for radiocommunication resources (radio transmission power, allocated frequency, etc.).
- Transmit precoding: A transmission-weighting process for increasing/decreasing antenna gain in a specific direction by controlling signal amplitude and phase of multiple antennas through digital signal processing.
- Modulation level: The number of signal phase points in data modulation. This number is 4 in Quadrature Phase Shift Keying (QPSK) and 16 in 16 Quadrature Amplitude Modulation (16QAM).
- Rank adaptation: A method for adaptively changing the number of spatially multiplexed streams according to propagation channel conditions. Given a propagation environment in which the number of eigenspaces (rank) needed for spatial multiplexing is large, the number of spatially multiplexed streams is made large to obtain high throughput.
- Time domain: In signal analysis, this domain is used to show the temporal makeup of a signal’s components. A time-domain signal can be converted to a frequency-domain signal by a Fourier transform.
- Slot: A unit for scheduling data consisting of multiple Orthogonal Frequency Division Multiplexing (OFDM) symbols.
- Frequency domain: In signal analysis, this domain is used to show the frequency makeup of a signal’s components. A frequency-domain signal can be converted to a time-domain signal by an inverse Fourier transform.
- RR algorithm: A radio-resource allocation algorithm that guarantees fairness among MSs by allocating radio resources to multiple MSs in order.
- MRC: A technique that adjusts signal amplitude and phase in each antenna to obtain a composite output that maximizes SNR.
- SVD: In linear algebra, a matrix decomposition method for matrices with real or complex components.
- Propagation channel matrix: A matrix composed of the changes in amplitude and phase on the transmission path (channel) between the transmit and receive antenna.
- Hermitian transpose: The matrix obtained by transposing each element of a matrix or the rows and columns of a complex matrix containing complex numbers and taking the conjugate of each element.
- MIMO layer: In MIMO, the multiplex number when multiplexing different signals with spatial multiplexing on the same radio resources with different antennas.
- Precoding matrix: A matrix based on precoding weights for controlling the phase and amplitude of the transmit signal.
- Covariance matrix: A matrix whose diagonal components express the variance of each variable in a set of variables and whose other elements each express the degree of correlation between two variables with respect to their direction of change (positive/negative).
- SINR: The ratio of desired-signal power to the sum of all other interference-signal power and noise power.
- MMSE: A method for demodulating a signal that minimizes mean-squared error.
- IRC: A method for rejecting an interference signal by creating an antenna-gain drop point with respect to the arrival direction of that signal.
- Backhaul: The circuit connecting a wireless base station to the core network.
- Center frequency: The frequency within a frequency band at the center of the range used for communication.
- Planar array: An array structure that arranges antenna elements on a two-dimensional plane.
- Duplex mode: A communication scheme that performs transmission in both UL and DL directions simultaneously. Generally implemented as Frequency Division Duplex (FDD) or Time Division Duplex (TDD) (see *40).
- TDD: A signal transmission method in which the same carrier frequency and bandwidth is partitioned into time slots used for UL and DL.
- Multipath Rayleigh fading: A phenomenon by which radio signals emitted from a transmit point traverse multiple transmission paths (multi-path transmission) and combine at a moving receive point resulting in severely fluctuating receive levels. It is known that this statistical fluctuation distribution approximates a Rayleigh distribution especially in a non-line of sight propagation environment.
- Channel model: A model simulating the behavior of radio waves, used for evaluating the performance of wireless communications systems.
- Correlation: An index expressing similarity between different signals. Expressed as a complex number, its absolute value ranges from 0 to 1. Similarity is higher for a value closer to 1, in which case signal separation at the receiver is difficult resulting in a drop in communication speed in MIMO transmissions.
- Geometry: An index indicating area quality using received power distribution, etc. A higher absolute value indicates better quality.
-
4.1 Overview
Open
We have developed a “6G simulator based on a real environment model” with the aim of evaluating throughput in a real environment. This simulator can evaluate and visualize throughput in 5G and 6G based on propagation characteristics obtained by ray tracing calculations using point cloud data. Though based on the 6G simulator reported in Ref. [7], this simulator uses information on the propagation characteristics obtained by ray tracing calculations as a channel model between BSs and MSs used in system-level simulations. Specifically, the information used by this simulator consists of the path loss, angle of arrival of arriving waves, and propagation delay calculated by ray tracing.
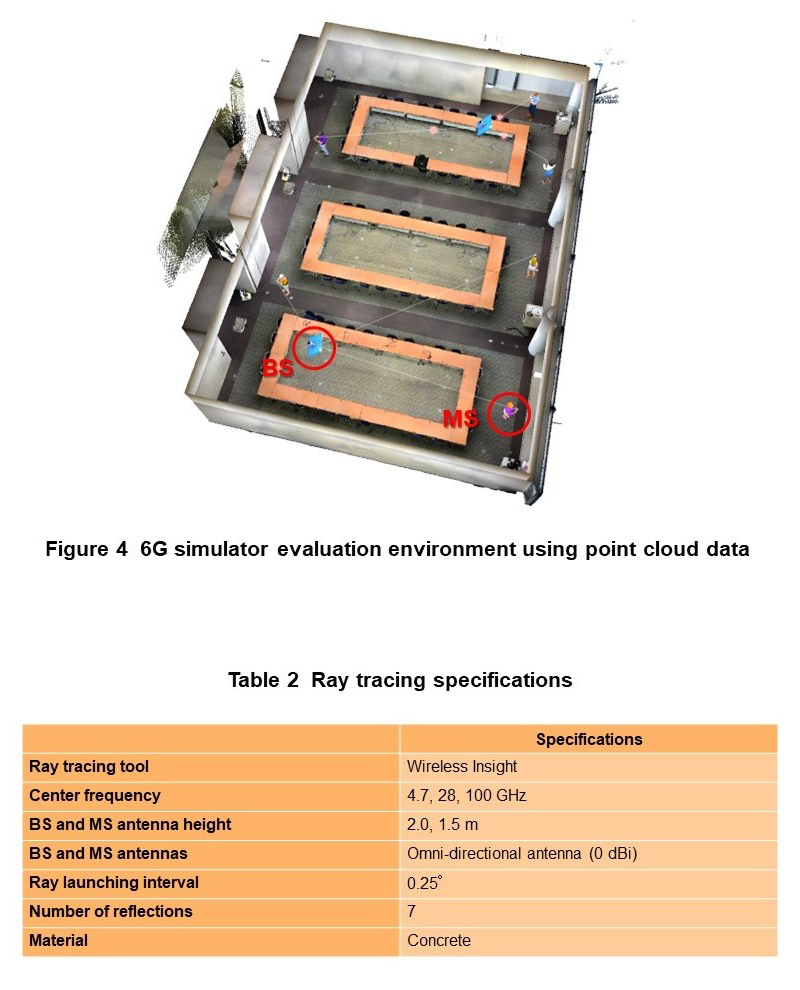
The evaluation environment used in this simulation is shown in Figure 4. This simulator can display an image of any environment targeted for evaluation using the point cloud data obtained for that environment. The figure shows the image generated using the point cloud data obtained in a conference room. This image also reproduces the actual conference room in color by using camera-based image data obtained at the same time as point cloud data. The simulator can place BSs and MSs at any positions, and here, the figure shows an evaluation environment for two BSs and six MSs. When multiple BSs are deployed in the simulation, the throughput of an MS at any position can be evaluated by inputting into a tool the ray-tracing calculation results when MSs are deployed within the evaluation area for each BS. However, MS movement is not supported here.
This simulator can also display color maps for several propagation parameters so that the relationship between propagation characteristics and throughput characteristics can be visually grasped. Ray tracing calculation specifications are listed in Table 2. In these calculations, the polygon data generated by point cloud data for the conference room shown in Fig. 4 is input into Wireless Insight, a commercially available ray tracing tool. The center frequencies used here are 4.7, 28, and 100 GHz assuming 5G and 6G. The type of antenna used by both BSs and MSs is an onmi-directional antenna*45, BS and MS antenna heights are 2.0 m and 1.5 m, respectively, and the condition for ray searching is 7 reflections. The calculations are performed assuming that the material of wall surfaces is concrete.
4.2 Simulation Results
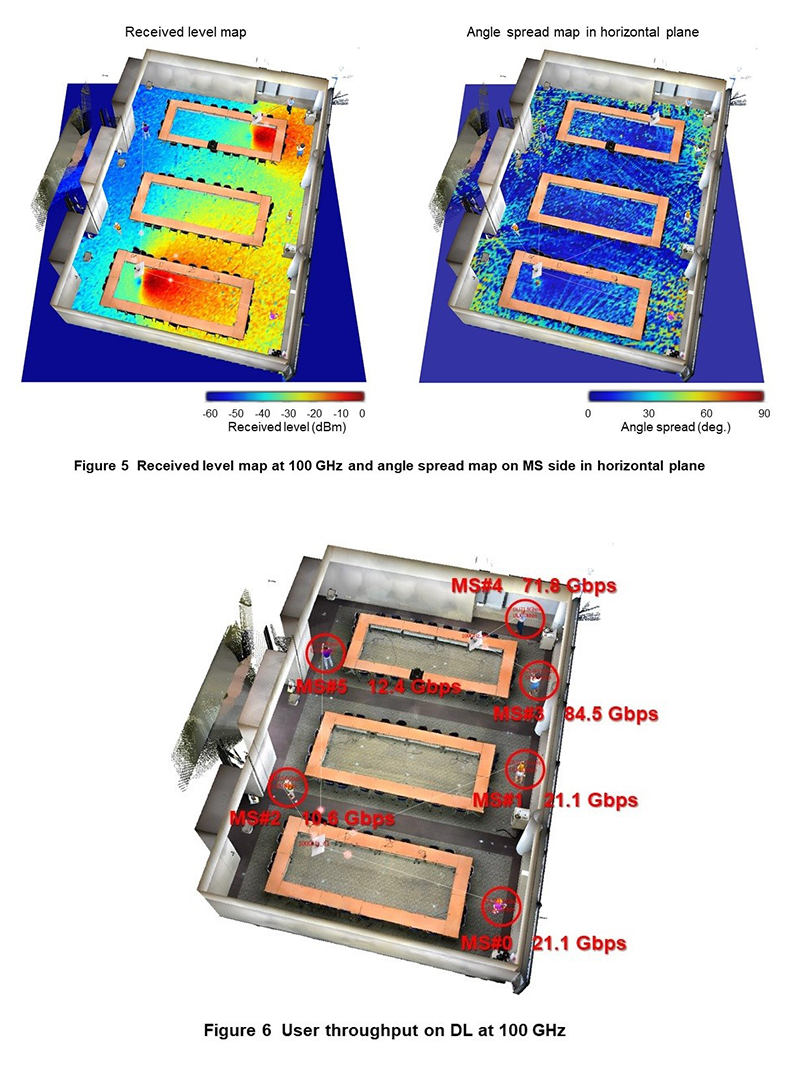
Examples of propagation characteristics calculated by ray tracing are shown in Figure 5. This figure consists of color maps showing the received level at 100 GHz and the angle spread*46 on the MS side in the horizontal plane. From these maps, it can be seen that the received level is high near each BS and that the angle spread becomes larger near the walls of the conference room due to the effects of reflection.
Next, we describe throughput characteristics calculated by this simulator based on the propagation parameters calculated by ray tracing as described above. The specifications for system-level simulation of this simulator are the same as those listed in Table 1, but no distributed MIMO technology is applied here. The simulator generates a fading channel*47 based on each ray’s path loss, propagation delay, and arriving angle calculated by ray tracing and calculates throughput when performing BF by massive MIMO and MIMO spatial multiplexing. Here, user throughput on the DL at 100 GHz is shown in Figure 6. The figure shows user throughput for MS #0–5 circled in red. It can be seen that MS #3 and MS #4 located in the areas of Fig. 5 having a high received level and large angle spread can achieve high throughput.
In a similar manner, this simulator could also display user throughput on the DL at 4.7 and 28 GHz. The throughput average of six MSs at 4.7, 28, and 100 GHz was found to be 0.62, 1.9, and 37 Gbps, respectively. These results confirm that throughput can be improved by using high frequency bands to provide a wider bandwidth.
Going forward, we plan to compare throughput measured using experimental equipment in a real environment with the calculation results of this simulator to evaluate simulator performance and improve it accuracy. Additionally, with an eye to developing tools that can dynamically control and optimize 6G through CPS, we plan to conduct technical studies on raising the accuracy and speed of propagation simulations using real environment models and transmission simulations at the link and system levels.
- Omni-directional antenna: An antenna for which radio-wave intensity is equal in all directions. Also called a non-directional antenna.
- Angle spread: For radio propagation, the spread in arrival angle of signals along all paths due to reflection and diffraction from buildings and other objects. Defined by a standard deviation of arrival angles of signals arriving on all paths, weighted by received signal power.
- Fading channel: The ever-changing fluctuation of received power at a MS caused by the scattering and reflection of transmitted signals off of buildings.
-
In this article, we described the development of two new simulators ...
Open
In this article, we described the development of two new simulators as enhanced 6G simulators. The first simulator introduces distribute MIMO technology in an outdoor urban environment as an added scenario in which throughput can be greatly improved in both the DL and UL in three frequency bands including the 100 GHz band. The second simulator can evaluate system performance in any environment based on real-environment models using point cloud data. Looking to the future, we will continue to enhance our 6G simulators so that the performance of various 6G technologies can be evaluated and visualized on the system level and use cases of the 6G era can be virtually experienced based on that performance.
-
REFERENCES
Open
- [1] NTT DOCOMO: “5G Evolution and 6G White Paper, Version 5.0,” Jan. 2023.
 https://www.docomo.ne.jp/english/binary/pdf/corporate/technology/whitepaper_6g/DOCOMO_6G_White_PaperEN_v5.0.pdf (PDF format:4,110KB)
 - [2] Y. Kishiyama et al.: “Trends and Target Implementations for 5G evolution & 6G,” NTT DOCOMO Technical Journal, Vol. 23, No. 2, pp. 4–13, Oct. 2021.
- [3] S. Suyama, T. Okuyama, Y. Kishiyama, S. Nagata and T. Asai: “A Study on Extreme Wideband 6G Radio Access Technologies for Achieving 100 Gbps Data Rate in Higher Frequency Bands,” IEICE Transactions on Communications, Vol. E104-B, No. 9, pp. 992–999, Sep. 2021.
- [4] S. Suyama, T. Okuyama, N. Nonaka and T. Asai: “NTT DOCOMO’s Activities toward Use of Sub-terahertz Waves in 6G,” IEICE General Conference, CI-7-6, Mar. 2022 (in Japanese).
- [5] M. Nakamura et al.: “Propagation Simulations and Experiments in Sub-terahertz Band toward 6G,” NTT DOCOMO Technical Journal, Vol. 25, No. 2, Oct. 2023.
- [6] NTT DOCOMO Press Release: “DOCOMO and NTT Expand 6G Collaborations with World-leading Vendors Including Ericsson and Keysight Technologies,” Feb. 2023.
https://www.docomo.ne.jp/english/info/media_center/pr/2023/0227_01.html - [7] T. Okuyama et al.: “6G System-level Simulator—Toward 100 GHz Band, 100 Gbps Extreme-high-data-rate Communications—,” NTT DOCOMO Technical Journal, Vol. 23, No. 3, pp. 13–26, Jan. 2022.
https://www.docomo.ne.jp/english/binary/pdf/corporate/technology/rd/technical_journal/bn/vol23_3/vol23_3_003en.pdf (PDF format:8,007KB) - [8] J. Jarvelainen, K. Haneda and A. Karttunen: “Indoor Propagation Channel Simulations at 60 GHz Using Point Cloud Data,” IEEE Transactions on Antennas and Propagation, Vol. 64, No. 10, pp. 4457–4467, Oct. 2016.
- [9] P. Koivumaki, G. Steinbock and K. Haneda: “Impacts of Point Cloud Modeling on the Accuracy of Ray-Based Multipath Propagation Simulations,” IEEE Transactions on Antennas and Propagation, Vol. 69, No. 8, pp. 4737–4747, Aug. 2021.
- [10] W. Okamura, R. Lukita, G. Ching, Y. Matsuyama, Y. Kishiki, Z. Chen, K. Saito and J. Takada: “Simplification method of 3D point cloud data for ray trace simulation in indoor environment,” IEICE Communications Express, Vol. 9, No. 6, pp. 182–187, Jun. 2020.
- [11] K. Kitao, M. Nakamura, T. Tomie and S. Suyama: “Study of Raytracing using Point Cloud Data for Indoor Area Evaluation,” ICETC 2022, S1-6, Nov. 2022.
- [1] NTT DOCOMO: “5G Evolution and 6G White Paper, Version 5.0,” Jan. 2023.

